Editor’s Note
As gold prices reach unprecedented levels, this analysis examines the market dynamics and momentum driving the rally as we look ahead to 2026.

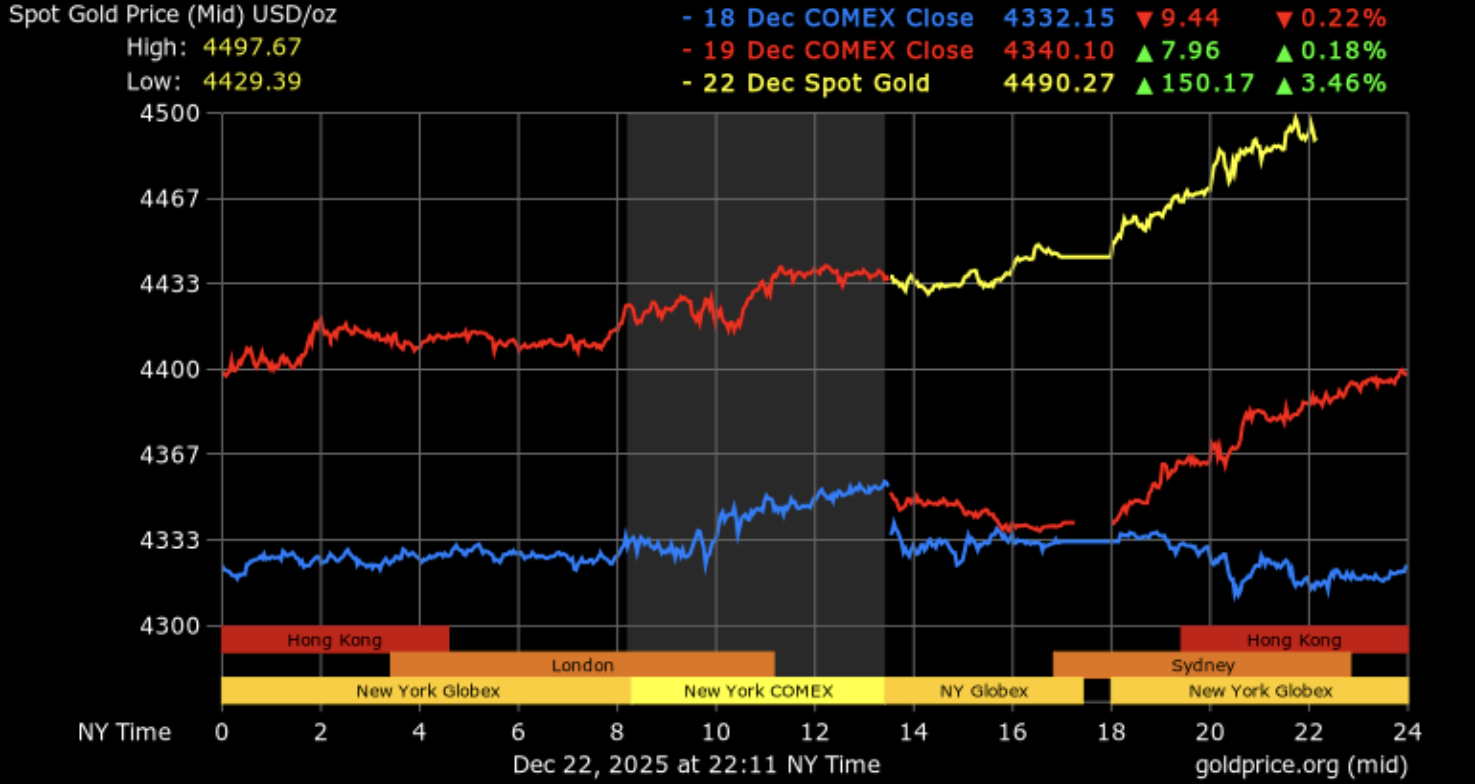
Gold concludes 2025 with price action forcing traders to recalibrate their usual reference levels. With gold already at all-time highs near $4,497, the market feels like a late-cycle move, marked by strong momentum, shallow pullbacks, and numerous late buyers chasing breakouts.
This is the framework traders must keep in mind as 2026 approaches. When gold rallies this powerfully, it can keep going even when indicators appear overextended. At the same time, the first real shift in interest rates, the dollar, or risk appetite can turn a vertical rally into a swift and unpleasant correction.
In the following forecast article, we present a practical outlook for 2026 based on the latest market data, positioning indicators, and a comprehensive technical map with tradable levels.
Overall Technical Bias: Bullish, with overheating risk.
Short-term (next 1-2 weeks): Price may maintain a bid posture while above the $4,474–$4,462 pivot support. A firm, sustained push above $4,503–$4,516 opens the risk of continuation.
Medium-term (next 1-3 months): If price holds above the rising long-term averages around $4,316–$4,326, dips are more likely to be bought than sold.
Base Case for 2026: Range-bound to higher, with wide swings. The median of analyst forecasts for the 2026 average is $4,275, which can still include deep pullbacks and sharp spikes.
2026 Bull Case: A sustained break above $4,500 sets a path toward the next major magnet near $5,000 (a key range extension level from 2025).
2026 Bear Case: If rates stay persistent and the dollar strengthens, a pullback toward the low $4,200s and even the $3,500–$3,800 range becomes feasible.
| Indicator | Latest Value | Implication |
|---|---|---|
| Spot Price | $4,485.55 | Price is hitting new highs and momentum traders are in control. |
| 52-Week Range | $2,595.90 – $4,486.75 | Massive expansion in 2025, which generally means volatility in 2026 will remain elevated. |
| RSI (14) | 84.561 (Overbought) | The trend is strong, but late entries get punished even in a normal pullback. |
| MACD (12,26) | 27.88 (Buy) | Momentum remains positive and has not yet reversed. |
| ADX (14) | 74.515 | Trend strength is extreme. Ideal for trend-following, but dangerous for chasing. |
| ATR (14) | 12.5915 | Daily range is active. Position sizing is more important than prediction. |
| 200-Day Moving Average | $4,316.24 (simple) | The dividing line for the long-term trend. A break below it quickly changes behavior. |
| 50-Day Moving Average | $4,380.31 (simple) | Short-term trend support. If broken, pullbacks deepen. |
| Pivot S1 / Pivot / R1 (Classic) | $4,474.40 / $4,482.53 / $4,494.98 | A tight battlefield zone: fluctuations can be expected here due to thin liquidity. |
The peculiarity of this case is that an RSI above 80 is not a sell signal. It is more of a warning. It indicates the market is fluctuating rapidly and that late entries require stricter discipline.