Editor’s Note
The article highlights gold’s remarkable performance in 2025, marking its strongest year since 1979 and signaling a potential structural shift in the market. As we look ahead to 2026, the drivers of this rally—investor sentiment, monetary policy, and broader financial trends—present new uncertainties and questions for the coming year.

In 2025, gold achieved its strongest performance since 1979. Such momentum signals a structural turning point for the gold market, significantly exceeding its usual historical behavior and now placing it in a new dimension.
While 2025 was supported by gold investors, easing interest rates, and the general progression of financial markets, 2026 opens with new questions. The decline in interest rates could continue, but to a lesser extent. Furthermore, investment demand remains contingent on market sentiment, while central banks and jewelers are slowing their purchases.
How should we understand this new era opening for gold? And is the intensity of this momentum likely to continue in 2026?
2025 surpassed all expectations. For the third consecutive year, gold advanced by more than 10%. In 2025, the dollar-denominated gold price showed a performance of +65%. This is its strongest increase since 1979.
These performances illustrate the truly exceptional nature of the dynamics at work this year. Unlike the bullish cycle of 2000-2011, the gold price now seems supported by faster and more intense movements, reminiscent of the 1970s.
Source: Macrotrends
Unlike previous years, gold’s performance this year is driven by investment demand, the rise in stock indices, and easing interest rates. Analysis of the data available to us indicates that the performance observed in 2025 is largely attributable to a momentum phenomenon, i.e., a powerful bullish enthusiasm. However, this does not rule out, at this stage, a continuation of the bullish trend, which remains vigorous and implicitly supported by long-term fundamentals.

In the first three quarters of 2025, average investment demand increased by +76% compared to 2024. The scale of this massive return of investment in gold is comparable to that seen in 2020 and 2022.
In particular, gold demand via ETFs shifted from selling flows to clearly buying flows. Thus, the average quarterly demand for ETFs reached 206 tonnes in the first three quarters, a level not seen since 2020.
Source: World Gold Council
But is this investment flow sufficient to explain the rise in gold?
Compared to the previous year, overall demand remained almost stable in the first three quarters. Average jewelry demand notably contracted by more than 20%. Similarly, central banks maintained a very strong pace of purchases, despite a 22% decline in average demand compared to 2024. This phenomenon is typical of phases of rising gold prices, as the jewelry sector exhibits negative elasticity.
Conversely, there is a positive link between investment gold demand and the gold price. Nevertheless, all else being equal, the sensitivity of the gold price to investment demand, although significant, remains relatively very low (at least on a quarterly scale). Only a sudden increase in demand, and particularly in investment demand via ETFs, can be associated with a sharp rise, and potentially a peak, in the gold price.
Despite this, if this context recalls that of the 1970s, the environment is profoundly different. Unlike the 1970s, the world of this first quarter of the century is characterized by a massive return to gold by all institutions. The instability of the dollar and bonds undoubtedly underscores the need to resort to gold to ensure the stability of the global financial order.

Source: World Gold Council
Compared to the cycles observed over the past forty years, the gold price shows a clear detachment. This outperformance of gold relative to its normal cyclical behavior is not entirely exceptional, however. As the chart below shows, gold tends to follow cycles of about 15 to 16 years. The final years of this long cycle, represented at the beginning of the chart, are characterized by an extreme steepening of the gold price curve. This explains a high variance in gold’s evolution from one cycle to another.
Thus, the rise in the 1970s was the largest, followed by the rise observed in 2010 with a less pronounced price peak, and finally the false peak in the mid-1990s. Several studies have already led us to consider this long cycle since the liberalization of the gold price, ideally with 12 years of rise and 4 years of consolidation. Considering that the last major trough in the gold price occurred in 2015, this would indeed correspond to the upward movement we are observing today.
If we assume that the intensity of the upward trend is correlated with the duration of the appreciation phase, it is not excessive to anticipate a continuation of the movement. This could support the hypothesis of a more sustained rise.
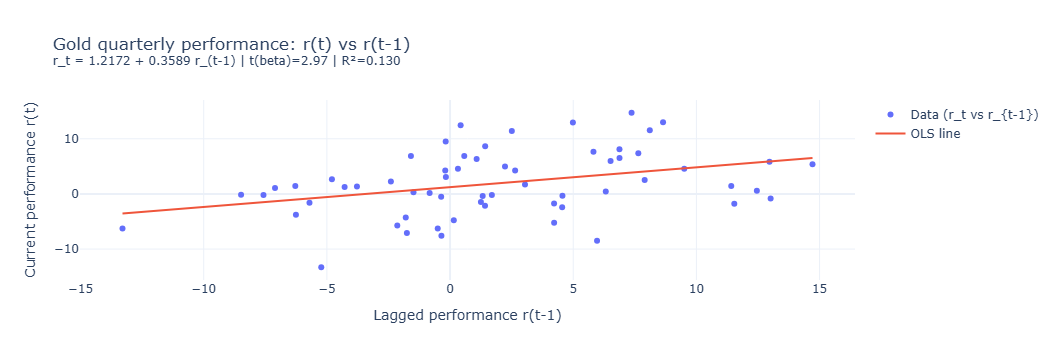
Furthermore, econometric study suggests that the gold price follows non-random behavior, at a minimum characterized by strong momentum. That is, a quarter showing bullish performance tends to be followed by another bullish quarter. Assuming only the validity of the momentum model below, the expected performance for 2026 could reach +20% to +25%. Nevertheless, other factors must be considered.
Search keywords: analysis forecasts market jewelry