Editor’s Note
This analysis examines the recent outperformance of silver and gold amid broader commodity market volatility, with a focus on their intraday price action.
Demarcating from their peers in the metals space, the two best performers are breaking out. Will it continue?
It has been a wild ride for metals in 2026 and bulls are back to prop up the best performers of the asset class to a renewed breakout. After a three-week correction period, Silver and Gold are now attempting to revisit their all-time records.
Recent US tariff chaos has brought renewed uncertainty to global markets, whether around trade or even geopolitics, allowing precious metals to attract some interest.
After the Supreme Court officially dismantled the IEEPA Liberation Day tariffs last Friday, President Trump immediately pivoted to his plan B. Within hours, he invoked Section 122 of the Trade Act of 1974—a Nixon-era policy designed to fix balance-of-payments deficits—to slap a 10% (quickly raised to 15%) global surcharge on imports. This measure is temporary (150 days) leading to immediate uncertainty on future US trade policies, normally expiring on July 23-24.
With $133 billion in illegal duties already collected under the now-defunct IEEPA regime (expiring tomorrow), the government is facing a budgetary nightmare as businesses line up for refunds.
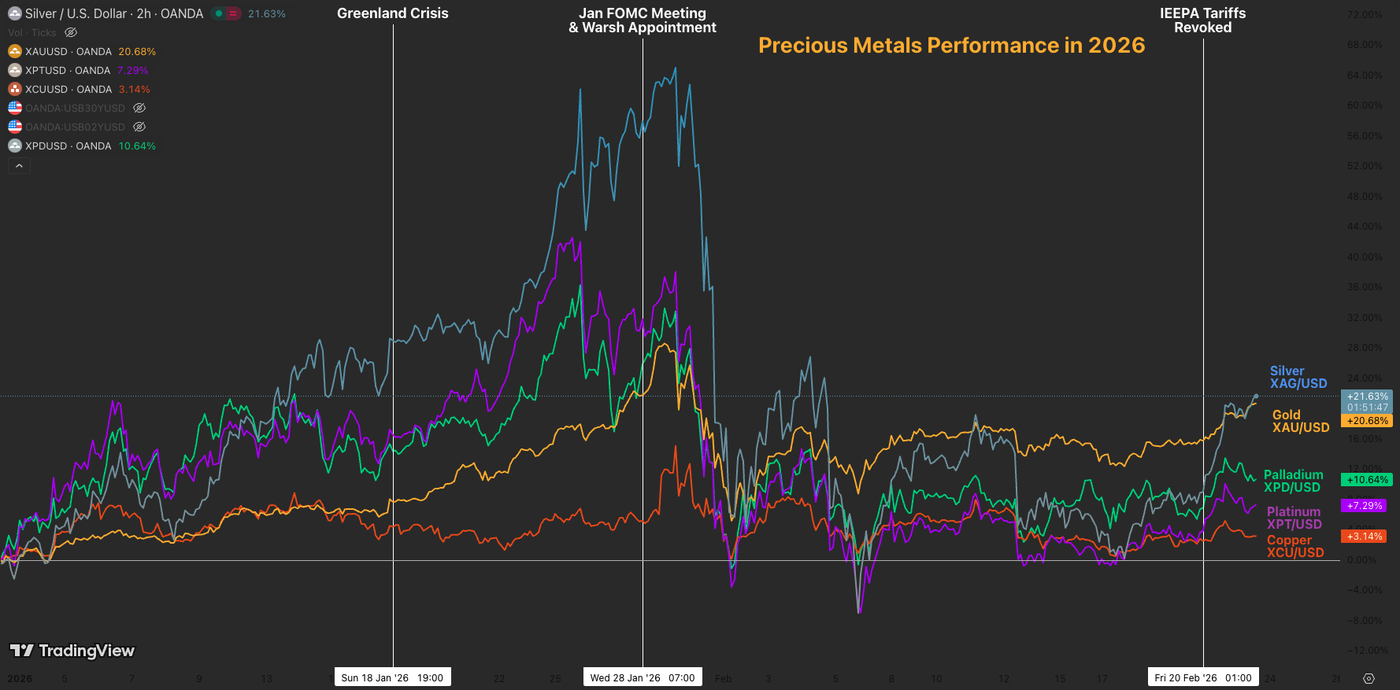
Gold and Silver are actually the dominant performers in the asset class, while Palladium, Platinum, and Copper struggle to gain significant momentum (broadly unchanged on the year). Both the Yellow and Grey metals are getting propped up from recent tariff developments and Middle East anxiety.
The divergence in today’s action shows one thing: the metals run is going to be more bumpy in the coming days. What was seen as a broad Dollar debasement is now considered a trickier play, with only a few regional products and assets outperforming, while the others remain dormant or even sell off. The same could be said about Equities.
In the meantime, we will dive into an intraday timeframe analysis for Gold (XAU/USD) and Silver (XAG/USD) to spot where the ongoing breakout is taking us.
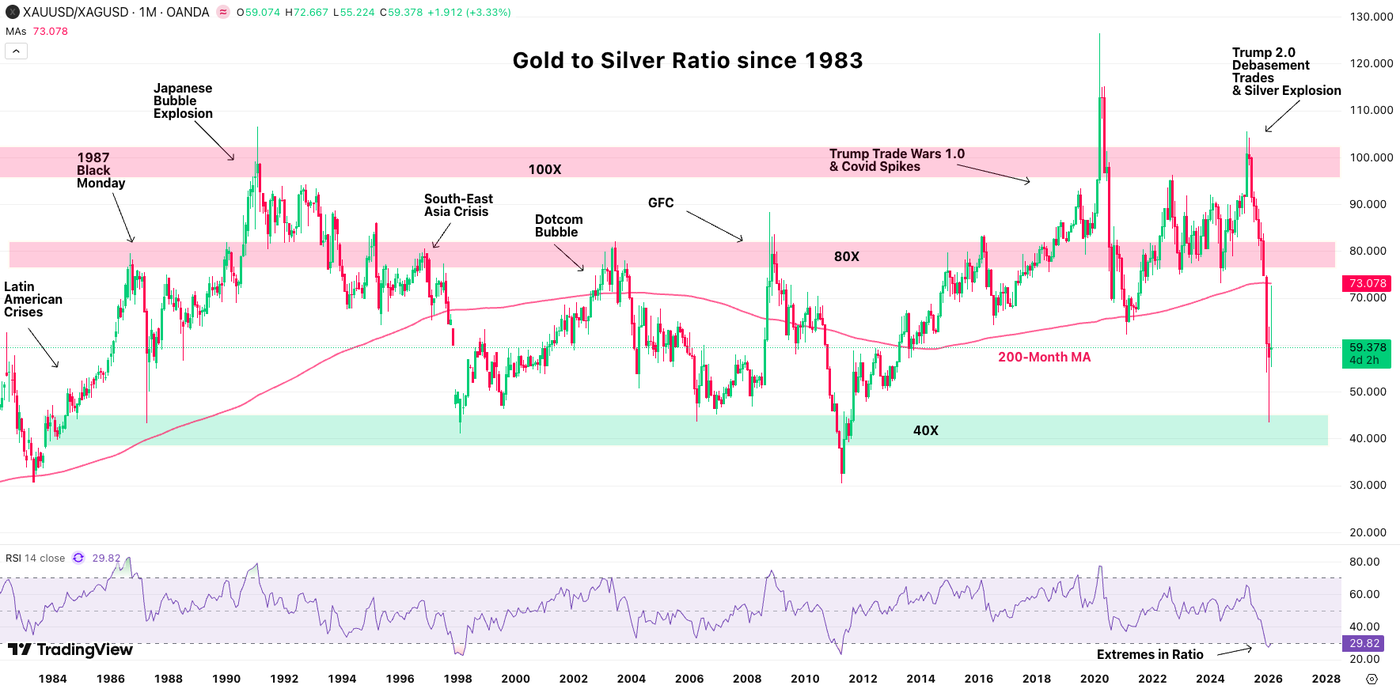
The Gold/Silver Ratio eased significantly from 100X to the current 60X level, right in the middle of the “Buy Gold at 40X, Sell Gold at 80X adage” zone. Silver seems to be taking the momentum back in today’s action but remains in a rough spot: Positioning, albeit less extreme than a month ago, could lead to less potential upside. Asset Managers are still deemed to be heavily invested in precious metals, so keep a close eye on upcoming times.
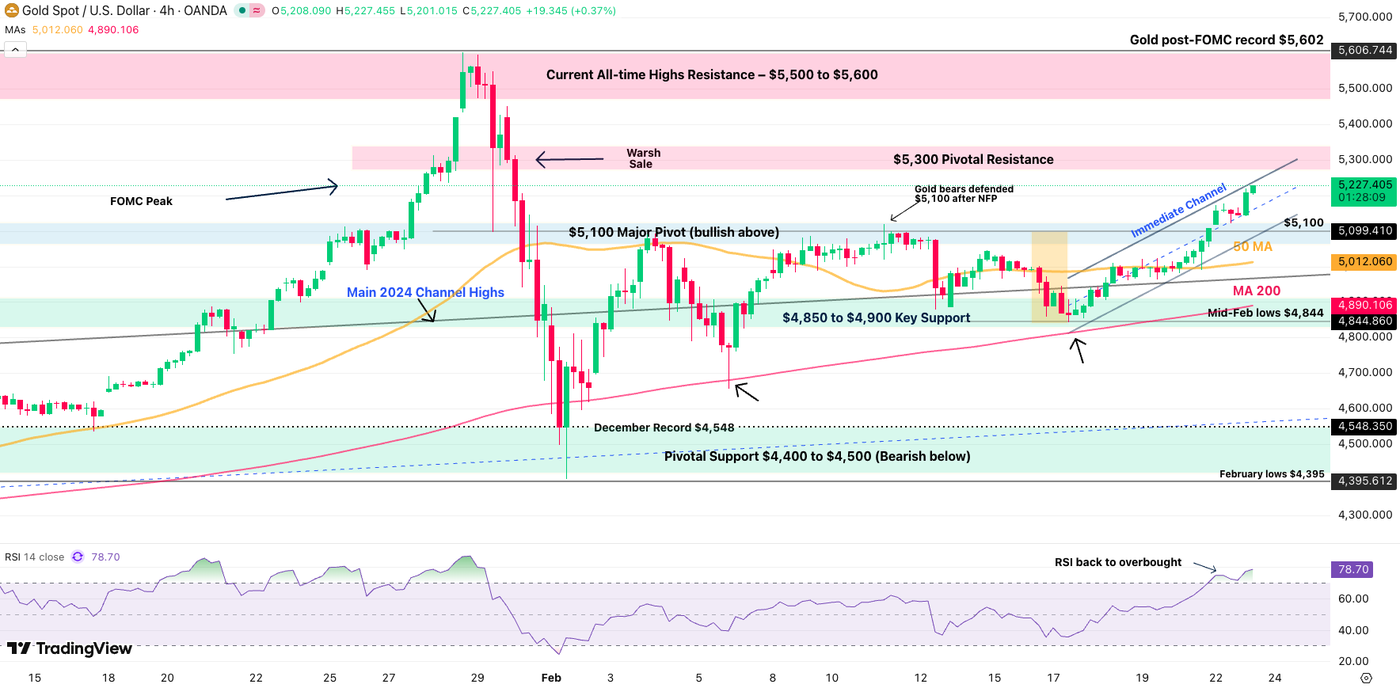
Gold is back to a very bullish price action, evolving in a Tight bull channel ever since reaching $4,844 in Mid-February. Despite the ongoing consequential rally, late buyers will have to be careful as prices reach the channel’s upper bound and overbought RSI levels.
If bulls manage to push the metal above $5,300 without a pullback however, a run to the $5,600 should soon follow. Keep a very close eye on the 4H 200 MA, which acted as major support throughout the entire trend.
Technical Levels to watch for Gold (XAU/USD):
Resistance Levels:
$5,230 Channel Top (intraday highs)
$5,300 Pivotal Resistance
$5,400 mini-resistance
Current All-time Highs – $5,500 to $5,600
Key Fibonacci Projection $5,800 to $5,900
Support Levels:
$5,100 Major Pivot (bullish above)
Mid-Feb lows $4,844
Pivotal Support $4,400 to $4,500 – Bearish below
Main Support $3,880 to $4,050
$3,200 to $3,500 Major Support
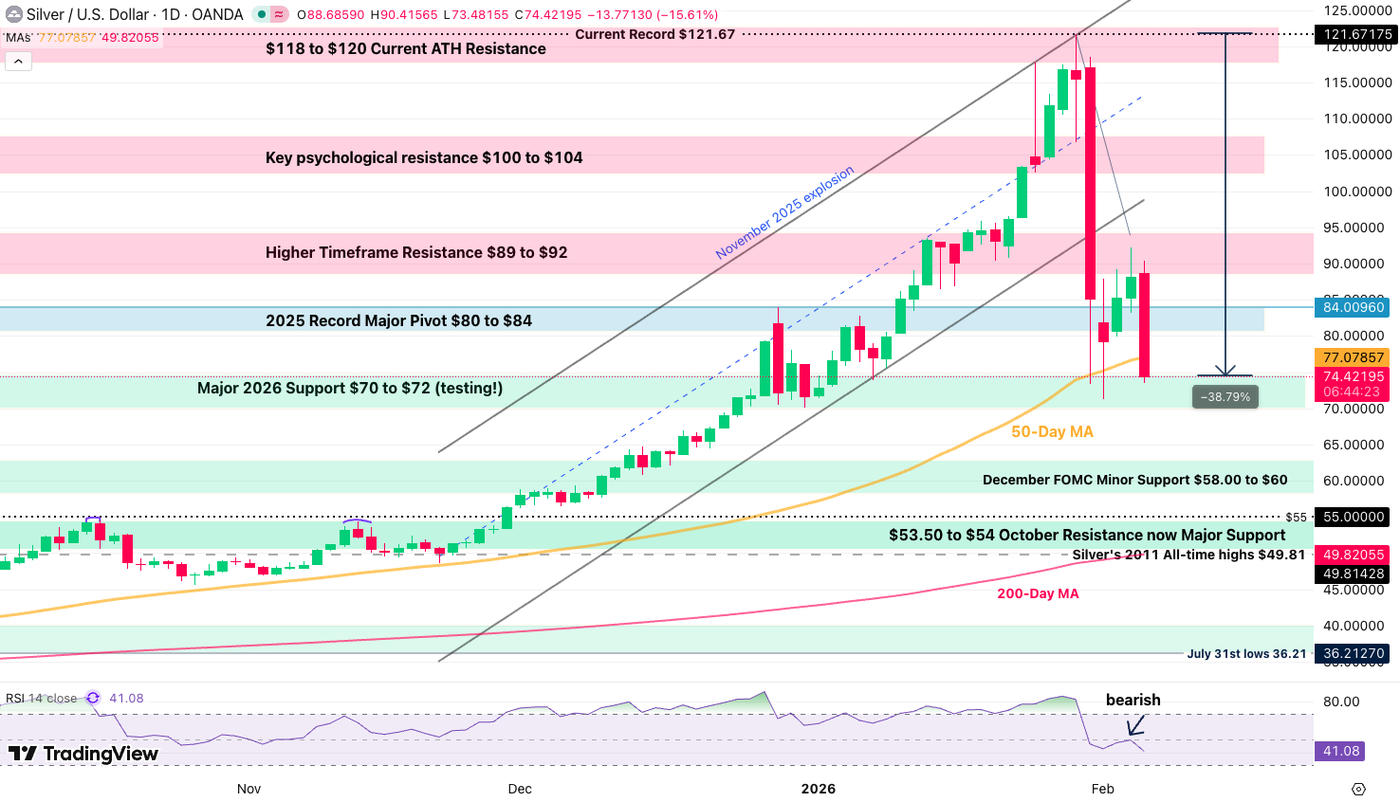
Silver is also back to a very impressive bullish momentum, getting close to reaching $90 after breaching its 4H 200-Period MA. Traders will have to be careful of the $90 to $95 higher timeframe resistance which acted as such in the early February rebound, particularly as overbought RSI conditions are arising.
Any close above the February highs ($92.20), should lead to a retest of $100.
Technical Levels to watch for Silver (XAG/USD):
Resistance Levels:
Feb 4 highs $92.20
Higher Timeframe Resistance $90 to $95
Key psychological resistance $100 to $104
Current Record $121.67
Support Levels:
2025 Record Pivot $82 to $84
Key Momentum Support $76 to $77.50
Major 2026 Support $70 to $72
February lows $64
$53.50 to $54 October Resistance now Major Support