Editor’s Note
Richemont’s latest quarterly results highlight the resilience of its core jewelry division, which continues to drive overall performance. While regional disparities persist, the group’s ability to surpass revenue forecasts underscores its strong market positioning. This analysis provides key insights for investors assessing the luxury sector’s trajectory.
On January 15, Richemont Group announced its financial results for the third quarter of fiscal year 2026. Revenue slightly exceeded market expectations, with the jewelry business showing strong growth. Performance varied across different regions, and the report also analyzed investment perspectives and business impact factors.
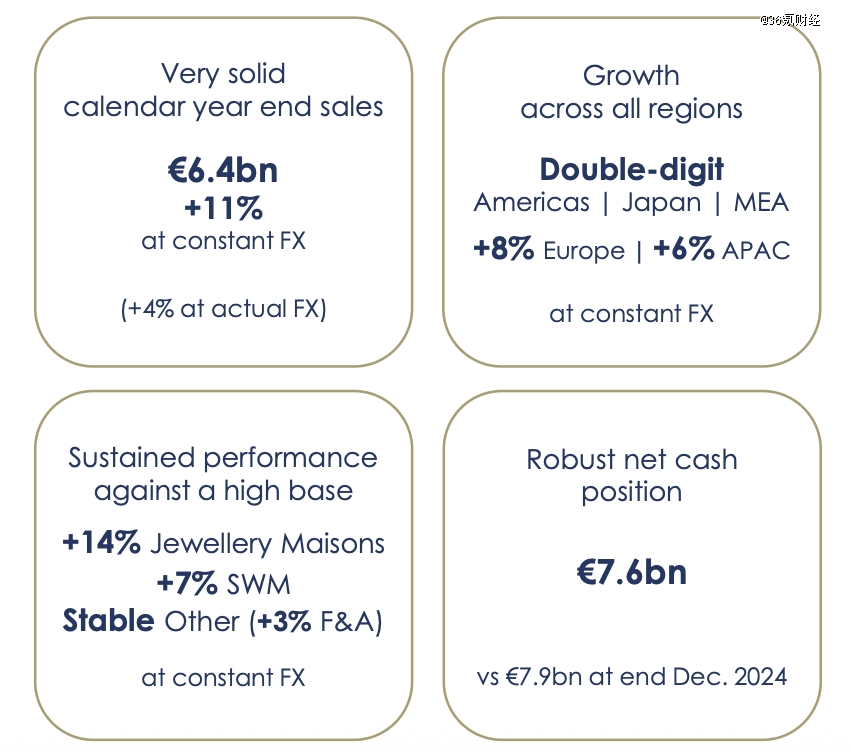
As of December 31, 2025, the company achieved revenue of €6.4 billion in FY26 Q3, slightly surpassing market expectations. Calculated at constant exchange rates, revenue grew 11% year-on-year; at actual exchange rates, growth was 4%. Cumulative revenue for the first three quarters of FY26 reached €17.0 billion, representing a 10% year-on-year increase at constant rates and 5% at actual rates. The company’s operating cash flow for the period was €7.6 billion, remaining stable overall.
From a brand segmentation perspective, jewelry revenue accounted for over 70% of the company’s total revenue, serving as its main pillar. Key brands include Cartier, Van Cleef & Arpels, and Buccellati. The watchmaking business is the company’s second-largest segment, with core brands including IWC, Jaeger-LeCoultre, Vacheron Constantin, and Piaget. Revenue from other businesses is comparable to watchmaking, with core brands such as Montblanc, Dunhill, Chloé, and Peter Millar.
Examining the regional revenue structure, Asia-Pacific, the Americas, and Europe are Richemont’s core business regions, accounting for 29%, 27%, and 24% of FY26 Q3 revenue, respectively. Japan and the Middle East & Africa each accounted for 10% of revenue during the same period. In terms of performance, all regions achieved positive revenue growth in the quarter when calculated at constant exchange rates, but significant differentiation in growth rates between regions remains evident.
Specifically, the Americas, Japan, and the Middle East & Africa achieved double-digit growth in the quarter, with corresponding revenue year-on-year growth rates of 14%, 17%, and 20%, respectively. However, compared to FY25 Q3, revenue growth in these regions has either plateaued or weakened to varying degrees. The core driver of revenue growth in North America was the double-digit growth of both jewelry and watchmaking businesses. Revenue growth in Japan was also primarily driven by the jewelry business, with the watchmaking business also showing positive growth. Demand for luxury goods in the Middle East & Africa was particularly strong, with all business segments achieving double-digit growth, and performance in the UAE market was especially outstanding.
Performance in the Asia-Pacific and European regions during the same period was relatively weaker, with corresponding revenue year-on-year growth rates of 6% and 8%, respectively. The growth trends at the edges of these two regions also show significant divergence. Europe’s revenue grew 19% year-on-year in FY25 Q3 but slowed to single digits this quarter. The Asia-Pacific region’s revenue decreased 7% year-on-year in FY25 Q3 but achieved positive growth this quarter, with the growth rate accelerating further compared to the 5% in FY26 H1.
Both jewelry and watchmaking contributed to revenue growth in the Asia-Pacific region this quarter. In terms of segmented markets, Greater China (Mainland and Hong Kong/Macau) saw slight revenue growth year-on-year, while other regions represented by South Korea and Australia showed steady and healthy growth. Revenue growth in the European region during the same period was primarily driven by the jewelry business, with watchmaking and fashion & accessories businesses also achieving positive growth.
From the perspective of business segments and regional market performance, the jewelry business was the core force driving the company’s revenue growth this quarter. Financial data shows that the jewelry business achieved revenue of €4.8 billion in FY26 Q3, a 14% year-on-year increase at constant exchange rates, with growth levels exceeding market expectations. Its revenue share for the period was 75%. Benefiting from comprehensive growth across all regions and channels, jewelry achieved double-digit growth on top of a high base from the same period last year.
In the long term, the company’s jewelry business has maintained steady revenue growth in recent years, with revenue growth rates showing a significant recovery after entering FY26. Financial reports show that jewelry revenue grew 21% year-on-year in FY23; mainly affected by macro factors, revenue growth slowed to 6% in FY24. This business saw a slight recovery to 8% growth in FY25. Jewelry revenue grew 11% and 14% year-on-year in FY26 Q1 and FY26 H1, respectively, and the revenue growth rate in FY26 Q3 continued this previous trend.
Although the watchmaking business also achieved positive revenue growth in all regional markets this quarter and contributed to the company’s overall revenue growth, its growth level was significantly lower than that of the jewelry business. Reflected in the financials, the watchmaking business generated revenue of €0.9 billion in FY26 Q3, a 7% year-on-year increase (at constant exchange rates), corresponding to a 14% revenue share. The performance of the watchmaking business varied across different regional markets, with demand in the Americas and the Middle East & Africa being relatively stronger.
From the company’s FY26 Q3 financial report, one can observe a phenomenon: whether calculated at constant exchange rates for the company’s overall or various business segments’ revenue year-on-year growth rates in the quarter, they are significantly higher than the calculation results under actual exchange rates. This phenomenon indicates that relatively strong demand in the luxury goods market is the core driving force behind the company’s performance recovery; but at the same time, the weakness of major trading currencies leading to exchange rate losses also had a certain negative impact on the company’s current performance.
On the cost side, rising prices of key raw materials have put pressure on the company’s overall profit margin. Public trading data shows that precious metal prices surged significantly in 2025, with gold’s annual increase exceeding 55%, platinum rising over 80% during the same period, and palladium’s increase even approaching 130%. The substantial price increase of precious metals pushed up the company’s cost pressure, creating a significant profit margin squeeze for core businesses like jewelry and watches. Moreover, the company’s management stated in last year’s conference call that in the raw material procurement process, operations related to hedging against volatile precious metal prices present considerable execution difficulties.
Looking at the demand level, the company’s revenue achieved slight growth exceeding expectations this quarter. On one hand, this benefits from the support of core regional markets with stable/recovering economies; on the other hand, it is mainly attributed to the new incremental demand for luxury goods generated by the wealthy class after profiting in capital markets.
Compared to ordinary consumers, the wealthy class holds a higher proportion of financial assets. Following the AI-driven global surge in major stock markets in 2025 and the synchronous rally in precious metal markets, precious metal stocks drove up the net asset value of related fund products like gold ETFs and silver LOFs. By holding the aforementioned financial assets, the wealthy class, while driving their own wealth growth, also saw sustained improvement in consumer confidence, leading to a明显 strengthening of demand for luxury goods.
According to relevant survey report data, the proportion of wealthy consumers in domestic and US markets who plan to increase spending on luxury goods in the next 12 months has significantly increased compared to the previous quarter.