Editor’s Note
As gold prices resume their climb, a notable shift is occurring in how investors seek exposure. This analysis highlights the move away from physical holdings toward gold-backed ETFs, underscoring gold’s evolving role as a financial safe haven rather than a luxury commodity.
Gold ETF share ↑ 74%, Physical demand ↓
$26 billion inflow… Preference for safe-haven assets
International gold prices, which had been catching their breath near $4,000 per ounce, have turned upward again. As gold prices show an upward trend, a clear pattern is emerging globally where investors are buying gold through ETFs (Exchange-Traded Funds) instead of physical gold and jewelry.
As gold is highlighted more as an investment asset rather than a luxury good, demand for gold bars and gems is decreasing, while demand for gold as a financial investment product is rapidly expanding.
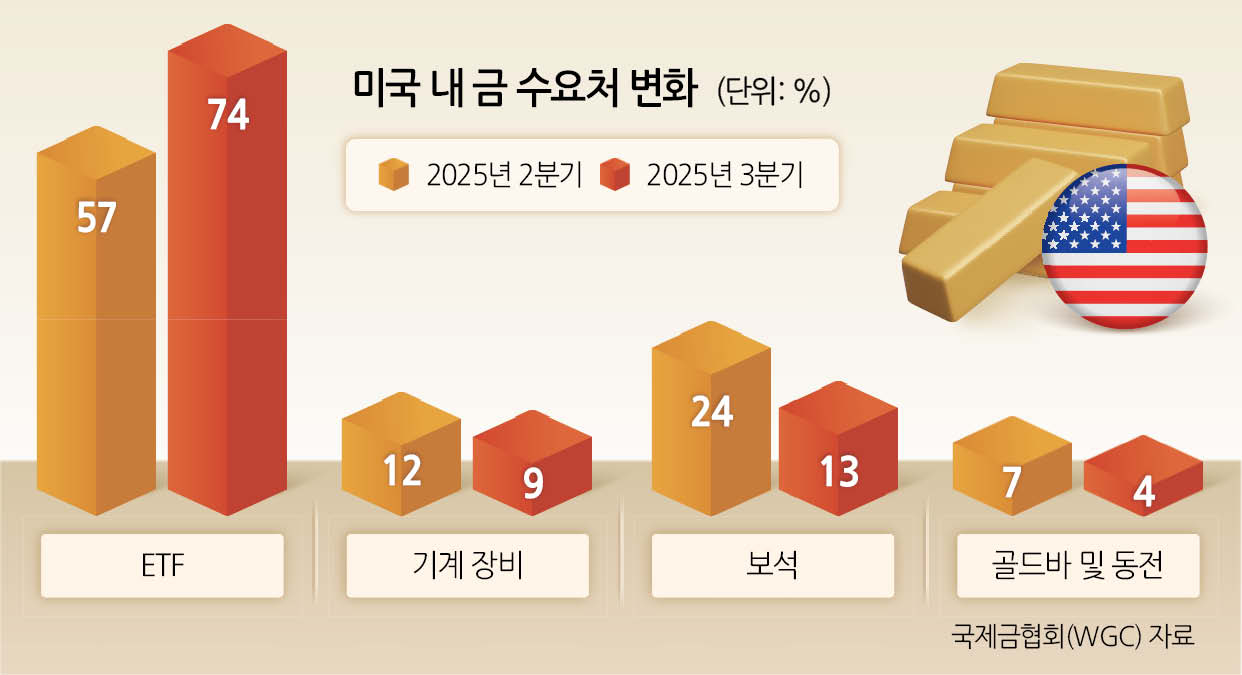
According to the ‘U.S. Gold Demand Trends Report’ released by the World Gold Council (WGC) on the 5th, the share of ETFs in total gold demand in the third quarter surged to 74%. Just two quarters ago, it was only 57%, jumping 17 percentage points in a short period.
In contrast, demand for jewelry and physical gold bars decreased simultaneously. Demand for gold for jewelry fell from 24% to 13% during the same period, and demand for gold bars and coins also dropped from 7% to 3%.
Not only relative demand but also the total consumption of gems decreased. Based on the third quarter, consumption of physical gold and gems in the U.S. recorded 25 tons, a 12% decrease compared to the previous year.
Total U.S. gold demand in the third quarter was 186 tons, a 58% increase year-on-year. Consumer demand, including gold jewelry, gold bars, and gold coins, was 32 tons, a 33% decrease year-on-year.
Gold jewelry consumption continued its declining trend since the second quarter of 2022, decreasing 12% year-on-year to 25 tons. In value terms, it recorded $2.7 billion, a 12% decrease quarter-on-quarter, but due to the sharp rise in gold prices, it increased 23% year-on-year.
Demand for gold bars and coins plummeted 64% year-on-year to just 7 tons. This is the lowest level since the lows of 2017-2019, before COVID-19, making the Americas the only major region to show a year-on-year decline in the third quarter.
In value terms, it also recorded $801 million, a 49% decrease year-on-year. However, the investment industry analysis suggests that net purchases of gold bars increased as profit-taking desires grew.
The technology (electronics industry) sector showed mixed results across the four major global manufacturing hubs. The U.S. decreased by 16 tons year-on-year, a 2% decrease. Japan also decreased by 19 tons, a 4% drop.
In contrast, South Korea increased by 1% year-on-year to 7 tons, while China and Hong Kong maintained a similar level year-on-year at a total of 21 tons.
ETFs have taken the lead again. U.S.-listed gold ETFs absorbed 137 tons in the third quarter, a sharp 160% increase year-on-year. Consequently, total holdings reached 1,922 tons (assets under management of $236 billion).
Fund inflows into gold ETFs also reached a record high. Globally, funds flowing into gold ETFs in the third quarter amounted to $26 billion, and holdings increased by 222 tons, totaling 3,838 tons. Notably, the U.S. accounted for 62% of global gold ETF demand, with inflows of 137 tons (approximately $16 billion).
The market views that if the U.S. buying trend in gold ETFs continues, the global gold price uptrend will persist. Coupled with the preference for safe-haven assets and inflation hedging demand, gold has risen as a core asset in portfolios. In particular, as volatility in the U.S. stock market increased last week, gold prices are showing signs of a rebound.